
Efficiently grasp improvement candidates by comparing measurement values of multiple molding equipment.
Graph the measurement values of multiple molding equipment and lines on the same time axis. This allows you to organize the trend differences between the equipment and narrow down the subjects for additional verification.
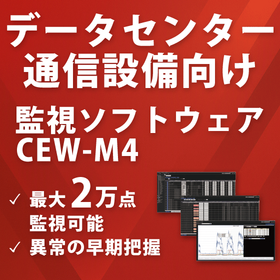
When managing multiple molding equipment and production lines, the screens and records are separated by equipment, making it cumbersome to compare measurement values over the same period. The monitoring software "CEW-M4" can display data such as current, power, energy, temperature, and humidity collected from connected sensors and measuring devices in comparison graphs on the same time axis. The monitoring software "CEW-M4" aggregates data from connected devices onto a web interface, allowing for list display, comparison, aggregation, history, CSV export, and alarm management. 【Challenges】 - Want to consolidate screens and records that are dispersed by equipment - Want to compare similar equipment or multiple lines over the same period - Want to select targets for additional verification based on trend differences 【Benefits of Implementation】 - Compare multiple pieces of equipment on the same time axis - Organize trend differences between equipment and lines - Narrow down equipment for additional verification You can check detailed features and screen examples in the downloadable materials. For more information, please download the materials or feel free to contact us.
